
 As a product manager, knowing the value of your products in the market is a never-ending pursuit. It is a fundamental gauge to determine whether the product needs changes and how best to position it in the market. There are different methods to assess value and use that to determine how to position the product. However, in this article, we will focus on Value Map, which is a tool to assess the positioning of your product in terms of price and customer value compared to the competition.
You may also be interested in the following:
- EVC, a value-based pricing technique based on Competitive Analysis
- 5 Reasons you need a product planning tool as a product manager
- The role of the modern product manager
What is a Value Map
A Customer Value Map or Value Map, for short, is a way to determine the customer's perception of your products in the market. The Value Map is a plot of your products alongside the competition. The horizontal axis shows the customer benefits, and the vertical axis shows the price the customers are paying, or are willing to pay, for the products.
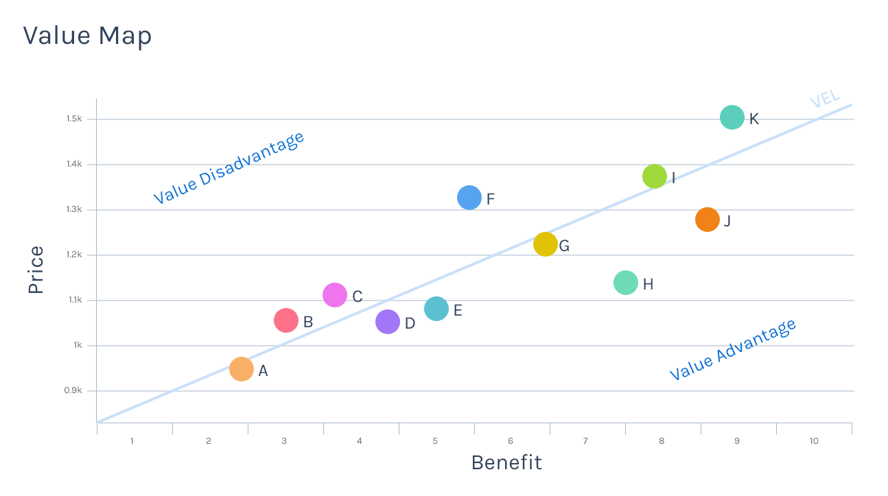
In a balanced market, products on a Value Map will lie somewhere on the Value Equivalent Line (VEL), which is what customers feel is the fair market value for a product with a specific benefit. By breaking this equilibrium, you create opportunities to disrupt the market share, position your product for growth, or adjust it for higher performance. Products above the VEL are considered overpriced while products below them are considered underpriced by customers.
Plotting the Value Map
Measuring customer benefits can be done by performing surveys, analyzing customer feedback and reviews, and using market research reports. Once you know what customers value, you can quantify it by creating an overall score. The overall score is a weighted score of each factor that matters to the customers.
To determine the price of the competitive products, you need to find out what customers are really paying for them and not just the list price. It is common for customers to pay below list price, which is the actual price customers are willing to pay for the product.
To start, you will need to collect the data which will be used to plot the Value Map and determine each products relative position to the VEL.
| PRODUCT | PRICE | BENEFIT |
| Product Name | Purchase Price | Benefit value |
Example: Price to Weighted Product Score
Let's assume you are the product manager for a laptop company. You are planning to release a new laptop with a low weight and faster processor. In researching the market, you have determined that your customers consider these two factors an essential benefit, with processor speed being critical and the weight of the laptop being less critical. Therefore, you give a weight of 10 for the speed of the laptop and a 5 for the actual weight of the laptop to calculate weighted scores across the products.
You also score each factor using a scale of 0-10. You have determined that anything above 5 GHz is considered a 10, and less than 1 GHz speed is considered a 0. For the weight of the laptop, you determined anything below 3lbs is regarded as a 10 and above 6lbs a zero.
You calculate the weighted score of your product similar to the competition as follows:
Your new product has a speed of 4Ghz, so you rate it a 9 out of 10 and it weighs 3 pounds, so you rate it 10 for weight. You then calculate the weighted score for your product as:
Score = (10x9+5x10)/(10+5)= 9.3
With this information, you complete competitive product table with Alpha, Cheetah, and Bizlap like so:
| PRODUCT | PRICE | SCORE |
| Alpha | $1,150 | 4.2 |
| Bizlap | $1,225 | 7.0 |
| Cheetah | $1,475 | 9.5 |
| My Product | $1,275 | 9.3 |
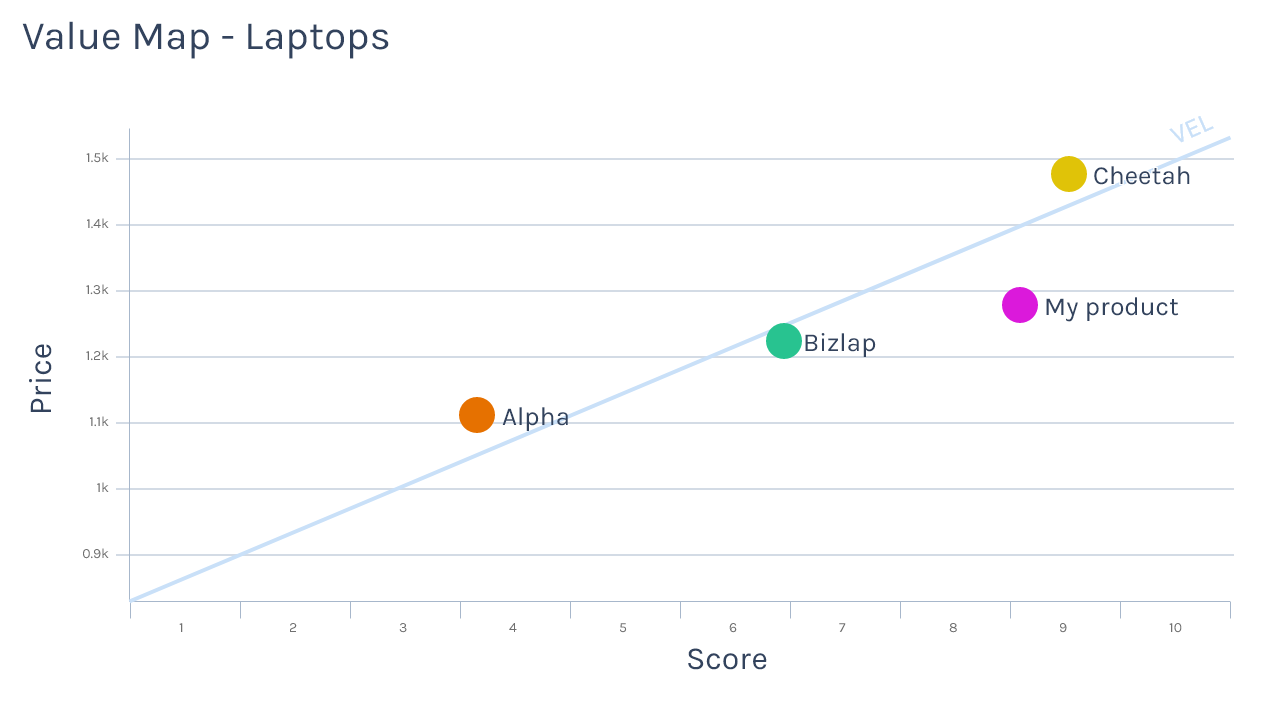
This data gets plotted onto the following Value Map.
Positioning your product to gain market share
To gain market share, you realize that Cheetah has a similar score of 9 out of 10. So you decide to consider entering the market at a lower price to create an opportunity.
You can also see that all competitive products fall approximately on a line which is your Value Equivalent Line. By positioning products above or below this line, you can disrupt the market. You can also go up and down that line to keep the market equilibrium and be less aggressive.
Value Maps are essential strategic tools that can help you visualize customer perception of your product and make better decisions on how to position your products in the market to gain a competitive advantage. Maintaining Value Maps and analyzing them overtime can provide product managers with valuable insights into their products.
We make this easy
With Gocious, you can reduce the time to calculate product scores and assess competitive products side by side. Contact us, and we would be happy to show you how to leverage our platform and our expertise to assess your competitive landscape.